
TIME ANALYZER REPORTS for SAP Migration
TIME ANALYZER REPORTS
This blog attempts to describe time analyzer reports, where to obtain the tool, how to generate the report and use them towards reducing migration downtimes.
What is Time Analyzer?
Time Analyzer reports are very useful in analyzing the export and import timings and tune the OS/DB migration downtimes. These reports can be generated in all cases of SWPM/sapinst or Migration monitor or distribution monitor. Time analyzer reports are generated using a tool called MIGTIME provided by SAP as part of the SWPM package. This tool reads the TOC (Table of Contents) files and the R3load logs for export/import and outputs the start, stop times and export/import durations of each package. The output is in the decreasing sorted order of durations of either export/import. The export and import times can also be combined into a single report to see how much time each of the packages took to export and import on the same line of the report.
Where can I get the time analyzer tool?
Time Analyzer tool is part of SWPM package provided in MIGTIME.SAR.
Below is a sample extraction of time analyzer tool:
Below is a sample extraction of time analyzer tool:
SAPCAR -xvf /sapstage/SAP_Acceleration/LINUX/70SWPM05_00/COMMON/INSTALL/MIGTIME.SAR
This will extract the below files:
This will extract the below files:
x migtime.jar
x export_time.sh
x import_time.sh
x time_join.sh
x export_time.bat
x import_time.bat
x time_join.bat
x TimeAnalyzer.pdf
x export_time.sh
x import_time.sh
x time_join.sh
x export_time.bat
x import_time.bat
x time_join.bat
x TimeAnalyzer.pdf
SAPCAR: 8 file(s) extracted
How to run Time analyzer?
To run the tool in its simplest form follow these steps:
- Login as root
- Set JAVA_HOME environment variable.(Example: export JAVA_HOME=/usr/java14_64 )
- Locate MIGTIME.SAR. For example this is found in 70SWPM package under /70SWPM05_0/COMMON/INSTALL/
- Uncar MIGTIME.SAR into the installation directory. Installation directory is the same directory where the TOC and LOG files are present. For example, if you are using sapinst to do export, then it is the sub-directory buried under sapinst_instdir where the log and TOC files are written by sapinst.
- Goto the installation directory and simply run the script: Run ./import_time.sh (if you are in the installation directory of import. Run ./export_time.sh (if you are in the installation directory of export)
- This will generate expor_time.txt or import_time.txt depending on if you are exporting or importing from the installation directory. The time analyzer report looks as follows.
Sample Time analyzer report:
Below is a partial report of export timings:
File: export_time.txt
dataDirs=/sapexport/mock2/as3_1/exportDirs/DATA
export=
html=
xml=
export=
html=
xml=
—————- |
package | Time | start Date | Start Time | End Date | End Time | size MB | MB/Min |
—————– | |||||||
ECLOG_XDAT | 10:10:09 | 9/24/2016 | 17:34 | 9/25/2016 | 3:45 | 1112.88 | 1.82 |
SAPUSER | 8:07:06 | 9/24/2016 | 17:19 | 9/25/2016 | 1:26 | 95257.86 | 195.56 |
APQD | 7:09:22 | 9/24/2016 | 17:34 | 9/25/2016 | 0:44 | 5512.87 | 12.84 |
STXL | 6:16:17 | 9/24/2016 | 19:57 | 9/25/2016 | 2:14 | 13066.71 | 34.73 |
COSP | 5:41:24 | 9/24/2016 | 19:07 | 9/25/2016 | 0:48 | 2714.43 | 7.95 |
ANLP | 4:35:15 | 9/24/2016 | 21:24 | 9/25/2016 | 2:00 | 5988.66 | 21.76 |
SAPAPPL0 | 4:25:39 | 9/24/2016 | 17:34 | 9/25/2016 | 1:31 | 6824.33 | 25.69 |
SAPSSEXC | 4:11:48 | 9/25/2016 | 0:49 | 9/25/2016 | 5:00 | 954.24 | 3.79 |
J_4I0DF001 | 3:48:13 | 9/24/2016 | 23:45 | 9/25/2016 | 3:33 | 5346.2 | 23.43 |
SAPAPPL1 | 3:01:47 | 9/24/2016 | 17:34 | 9/25/2016 | 1:48 | 4250.87 | 23.38 |
And partial output of import timings:
File: import_time.txt
File: import_time.txt
dataDirs=/sapexport3/as3_1/export_dump/DATA
html=
import=
installDir=/sapexport3/as3_1/miglog
xml=
html=
import=
installDir=/sapexport3/as3_1/miglog
xml=
————- |
package | Time | start Date | Start Time | End Date | End Time | size MB | MB/Min |
———— | |||||||
APQD | 4:13:36 | 9/24/2016 | 21:06 | 9/25/2016 | 01:20 | 5512.87 | 21.74 |
J_4I0DF001 | 4:13:33 | 9/25/2016 | 00:29 | 9/25/2016 | 04:43 | 5346.20 | 21.09 |
SAPAPPL0 | 3:22:49 | 9/24/2016 | 21:58 | 9/25/2016 | 01:21 | 6824.33 | 33.65 |
STXL | 3:20:56 | 9/25/2016 | 14:33 | 9/25/2016 | 17:54 | 13066.71 | 65.03 |
SAPAPPL1 | 3:16:31 | 9/24/2016 | 22:07 | 9/25/2016 | 01:24 | 4250.87 | 21.63 |
ANLP | 2:03:25 | 9/24/2016 | 22:26 | 9/25/2016 | 00:29 | 5988.66 | 48.52 |
S502 | 1:56:24 | 9/25/2016 | 14:11 | 9/25/2016 | 16:08 | 4692.72 | 40.32 |
RF048 | 1:54:19 | 9/25/2016 | 13:27 | 9/25/2016 | 15:21 | 1159.99 | 10.15 |
EDIDS | 1:46:41 | 9/25/2016 | 00:22 | 9/25/2016 | 02:09 | 7298.49 | 68.41 |
HUSSTAT | 1:44:11 | 9/25/2016 | 05:16 | 9/25/2016 | 07:00 | 1425.77 | 13.69 |
SAPAPPL2 | 1:37:22 | 9/24/2016 | 15:12 | 9/24/2016 | 16:49 | 1007.03 | 10.34 |
VBPA | 1:29:36 | 9/25/2016 | 15:13 | 9/25/2016 | 16:43 | 6214.83 | 69.36 |
CKMLCR | 1:24:59 | 9/25/2016 | 00:47 | 9/25/2016 | 02:12 | 1609.08 | 18.93 |
BSAK | 1:22:45 | 9/25/2016 | 01:55 | 9/25/2016 | 03:17 | 6471.35 | 78.2 |
Other options of time analyzer tool:
For complete list of all options of time analyzer tool, refer to the 7 page manual Timeanalyzer.pdf that is part of the MIGTIME.SAR
But here are some important options examples,
Option | Description | Comments |
xml | Create additional XML output file | XML output file contains all collected time information. Used as input file for Time Join tool. |
html | Create additional HTML output file | HTML output file contains package time diagram. |
dataDirs | List of data directories with binary data files and TOC files | Separator on Windows: ‘;’ Separator on UNIX: ‘:’ TOC files relevant only for export analysis. |
Example run:
On the source server used for the export:
export_time.sh -dataDirs /export/sbx/DATA -xml -html
On the target server used for import:
import_time.sh -dataDirs /export/sbx/DATA -xml -html
How to combine export and import time analyzer reports into one:
Here are some quick straightforward notes:
You need -xml to do time join
You need -html to generate HTML graph
Give both -xml and -html if you want both
You can use -m 1 to generate even table timings inside packages
You can skip -installDir if you are running in the same directory of export or import.
You need -html to generate HTML graph
Give both -xml and -html if you want both
You can use -m 1 to generate even table timings inside packages
You can skip -installDir if you are running in the same directory of export or import.
So do as below :
1) On the source:
export_time.sh -dataDirs /EPUMIGRATION/sbx/DATA -xml -html
2) On the target:
import_time.sh -dataDirs /EPUMIGRATION/sbx/DATA -xml -html
3) For time_join.txt (that is similar to the summary.txt generated by distmon):
- a) Copy export_time.xml from the export dir to target import dir
- b) In the import Dir on the target
time_join.sh -exportFile export_time.xml -importFile import_time.xml -html
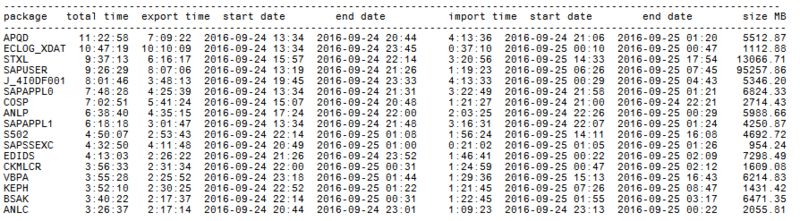
Sample output of combined timings of export and import:
File: time_join.txt
exportFile=export_time.xml
html=
importFile=import_time.xml
xml=
html=
importFile=import_time.xml
xml=
How to use the reports to reduce migration downtime
In most cases the duration of the export/import is determined by the package that takes the longest time to process. So you want to get started on that package first. Time anylzer report gives the packages in the decreasing order of the export/import durations.
So, if you process the packages in the order of the time analyzer report you can reduce the overall export duration of the system. You can do this by taking the first column (Package name) in the time analyzer report and create the OrderBy.txt file which is used by migration tools. For an overall export/import package order, take the package names from the combined timings time analyzer report.
So the OrderBy.txt file would look like as below (if you take the listing from time_join.txt)
File: OrderBy.txt
APQD
ECLOG_XDAT
STXL
SAPUSER
J_4I0DF001
SAPAPPL0
COSP
ANLP
SAPAPPL1
S502
SAPSSEXC
EDIDS
CKMLCR
VBPA
KEPH
ECLOG_XDAT
STXL
SAPUSER
J_4I0DF001
SAPAPPL0
COSP
ANLP
SAPAPPL1
S502
SAPSSEXC
EDIDS
CKMLCR
VBPA
KEPH
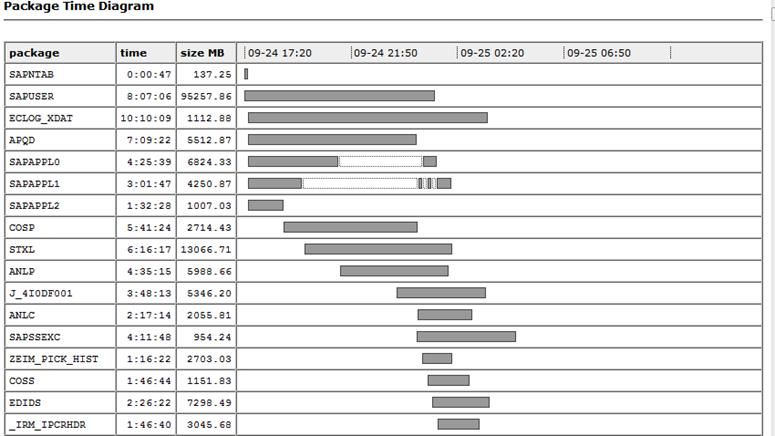
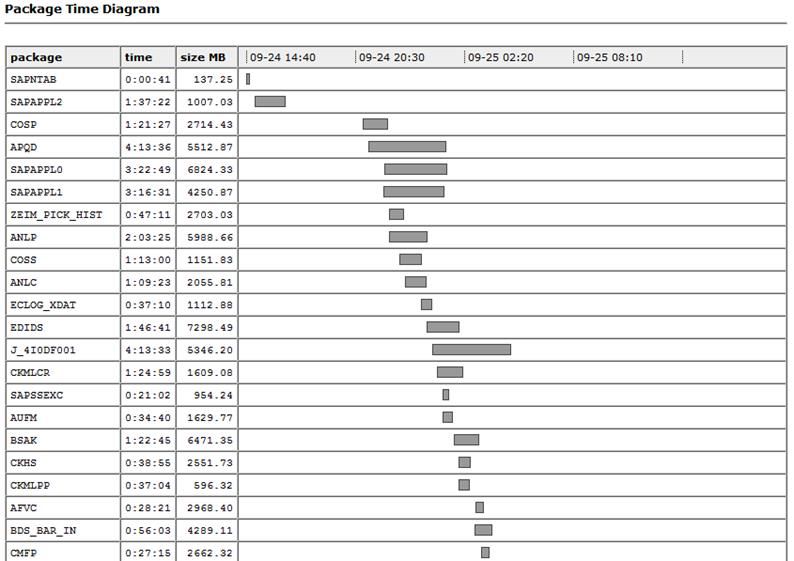
Sample outputs of graphical diagrams generated by -html option:
These outputs show when each package is started. This information can be very useful, if you like to avoid processing certain packages in parallel for any reason.
export_time.html
import_time.html
comments powered by Disqus